How to Read Weather Maps
Weather maps as they appear on TV, in a newspaper or here are called 'surface charts' or, more correctly, 'Mean Sea Level' (MSL) charts. They show what is happening at a set time where most of us need it - at the Earth's surface. They do NOT show what is happening at higher levels, where the wind flow may be doing something entirely different.
The Isobars
Those plain lines that curve across the map are called isobars (iso = equal, bar = pressure). They join together places with the same mean sea level air pressure (weight per square area of air above). Some have numbers on them showing this value in hectoPascals.
Isobars and the wind
Isobars can tell us about the wind. Christopher Buys-Ballot (1818-90), who was a Dutch meteorologist, made the vital link between isobars and wind in 1857. In the Southern Hemisphere, his rule is as easy to remember as three L's:
If you LOOK into the wind, the LOW pressure is on your LEFT.

So from the isobars you can estimate the winds, but it is not quite as easy as Buys-Ballot's law. Here are five wind tips:
1. Winds blow almost directly (but not quite) along the isobars.
This is just another way of giving Buys-Ballot's law. In the Southern Hemisphere the flow is CLOCKWISE around LOWS and COUNTER-CLOCKWISE around HIGHS. In the Northern Hemisphere the flow is the other way around. In the picture to the right, the wind direction is given by the red arrows.
2. The closer the isobars, the stronger the winds.
This varies with latitude ... on a weather map with isobars 4 hectoPascals apart, a spacing of about two degrees latitude (with straight isobars) means fresh winds about Auckland but a gale over Fiji.
3. Surface wind 'leaks' across the isobars towards lowpressure, by about 15 to 20 degrees over the open sea, but by as much as 30 to 90 degrees over and around land. This time, the red arrows show the wind directions as they are more likely to be - gently flowing across the isobars towards lower pressure.
4. Because of the 'spin-out' effect when turning corners, the wind speed can be:
- Up to 20% higher than the isobar spacing would suggest as the air turns around (and out of) a High
- As much as 20-40% lighter than the isobar spacing would suggest as the air turns around (and into) a Low.
- The blue arrows show the wind as it is likely to be; the red arrows show how the wind would be if it flowed parallel to the isobars. The longer the arrow, the stronger the wind.
- Where the flow curves strongly around the High, the blue arrow is longer than the brown arrow, meaning the wind is stronger than the isobar spacing suggests.
- Where the flow curves strongly around the Low, the brown arrow is longer than the blue arrow, meaning the wind is weaker than the isobar spacing suggest
5. Isobars are only smoothed-out approximations and only tell about the general wind flow, not the details. Wind flow over land is not simple ... it is like water flowing over a rocky brook, eddying around corners and rushing between boulders. Actual wind accelerates down valleys, bends around headlands, bumps about abutments, is contorted by the coastline, dips and dives over hills and dales, eddies behind mountains, and gallops through gaps. There is a natural reluctance for surface wind to move over land in the cool of the night or near dawn, and it may be drawn onshore during a hot day (sea breeze), or offshore at night (land breeze). Mountain air cooled at night sinks down valleys and flowsout to sea (katabatic wind). These effects do not show up in the isobars on the weather map but can halve or double the local wind speed, and distort its direction (always towards low pressure).
One terrain effect does show up on the weather map: chains of mountains distort isobars crossing them. In the example to the upper right, the Southern Alps buckle the isobars coming in from the Tasman Sea, with a build-up of pressure on the windward side and a counter-balancing drop of pressure down-wind from the mountains. Because of this distortion, avoid trying to use isobars over mountains to work out wind direction. Also, in general, avoid using isobars to work out windflow over high ground.
Also shown in the example to the upper right, in red, are observations of the surface wind at MetService stations for the same time as the isobars. The "long" part of the wind arrow shows the direction. As can be seen, some winds line up nicely with the isobars and others are almost at right angles to them.
The Highs
When isobars enclose an area of high pressure this is called a High or anticyclone and its centre is labelled on a weather map by an 'H'. The term 'anticyclone' is a bit of meteorological jargon.
The central pressure of a weak High is about 1015hPa,while a strong or intense High has a central pressureabove about 1030hPa. An intensifying High has a rising central pressure, while a weakening High has a falling central pressure.
Near a High's centre are light winds and sometimes areas of low cloud called anticyclonic gloom. Round the edge of a High, the winds are sometimes strong. Intense Highs tend to squeeze the isobars together creating areas of strong winds. Winter Highs often bring frost; summer Highs may bring thunderstorms and hail. The bigger Highs are, the slower they tend to move, sometimes 'blocking' the fronts that are trying to follow them.
The Lows
Isobars make shapes and patterns. When they enclose an area of low pressure this is called a 'Low' or 'depression' and its centre is labelled on a weather map with an 'L'. The term depression is a bit of meteorological jargon.

A low pressure system is like a giant funnel of wind spiralling inwards and upwards forcing warmish air in the centre to rise. As air rises it cools and clouds form.
The central pressure of a shallow Low is above 1000 hPa, of a moderate Low 980-1000 hPa, and of a deep or intense Low below 980hPa. If there are two or more centres the Low is said to be complex. If the central pressure is rising the Low is said to be filling or weakening. If the central pressure is falling the Low is said to be intensifying or deepening.
The satellite picture to the upper right (from the satellite GMS-5, courtesy of the Japan Meteorological Agency) shows cloud patterns fairly typical of those associated with Highs and Lows
Air Masses
An air flow originating from a prescribed location (warm, cold, moist or dry) is called an air-mass. Air-masses are named according to where they have come from and each has its own characteristic temperature and humidity.
- A tropical air-mass consists of air flowing from the tropics (WARM)
- A polar air-mass consists of air flowing from polar regions (COLD)
- A maritime air-mass is one flowing over a large sea area (MOIST)
- AA continental air-mass is one flowing over a large land area (DRY)
The air-masses reaching New Zealand are generally either maritime polar or maritime tropical.
Fronts, Troughs and Convergence Zones
A front marks the boundary between two air-masses, and appears on the weather map as a line with triangles or semicircles attached.
A cold front is the leading edge of a invading colder air-mass and is marked by a line with triangles pointing to where it is moving. Cold fronts push in underneath the warmer air ahead of them, forcing the warm air upwards and making cloud and areas of rain. The cloud band is usually about 50 to 400 kilometres (30 to 200 nautical miles) wide. As a cold front passes by: any rain clears but showers may appear, humidity drops, air temperature usually drops, pressure rises and thewind changes direction. |
A warm front is the leading edge of an invasion of warmer air. Its surface position is marked by a line with semicircles pointing to where it is moving. The advancing warm air rises over a zone of retreating cooler air, making a cloud bank that slopes forwards from ground level upwards, often bringing prolonged steady rain. This cloud bank can be 500 to 1000 kilometres (270 to 540 nautical miles) wide. As a warm front passes by: any rain becomes patchy but humidity remains high, air temperature may rise a little, pressure steadies, and the wind changes direction. |
An occluded front or occlusion occurs when a cold front overtakes a warm front, so that all that remains of the original warm air is trapped above, where it cools making dense cloud and rain. It is marked by a line with triangles and semicircles on the same side, pointing to where the front is moving. As an occluded front passes by: any rain becomes patchy, wind eases, the rate of pressure fall may level outbut air temperature does not change much. |
A stationary front is one which has lost its impetus for movement, so that neither air-mass is making much progress. It is marked by a line with alternate triangles and semicircles on opposite sides ... the triangles protruding into the warmer air-mass and the semicircles protruding into the cooler air-mass. It takes a while for a stationary front to pass by: any rain clears only slowly and temperature and pressure do not changemuch. |
When isobars make a sharp bend around a Low, this bend area is calleda trough of low pressure or simply a trough. Troughs are also often shaped like tongues and usually contain weather similar to lows and fronts. |
Horizontal convergence is the coming together of two flows of air. When these two flows of air are from different air masses and significant cloud and weather result, the resulting line of convergence is commonly drawn as a front. However, when these two flows of air are in the same air mass and significant cloud and weather result, the weather feature is drawn as a convergence line. Convergence lines are only drawn in the tropics. |
Ridges and Cols
When isobars turn a sharp corner around a High they form what is called a ridge of high pressure, which is often shaped like a tongue extending from the High centre. The weather in a ridge is an extension of the weather in the High. A col is the name for the area of light variable winds that lies between two neighbouring pressure systems. Often this area contains either fog or thunderstorms
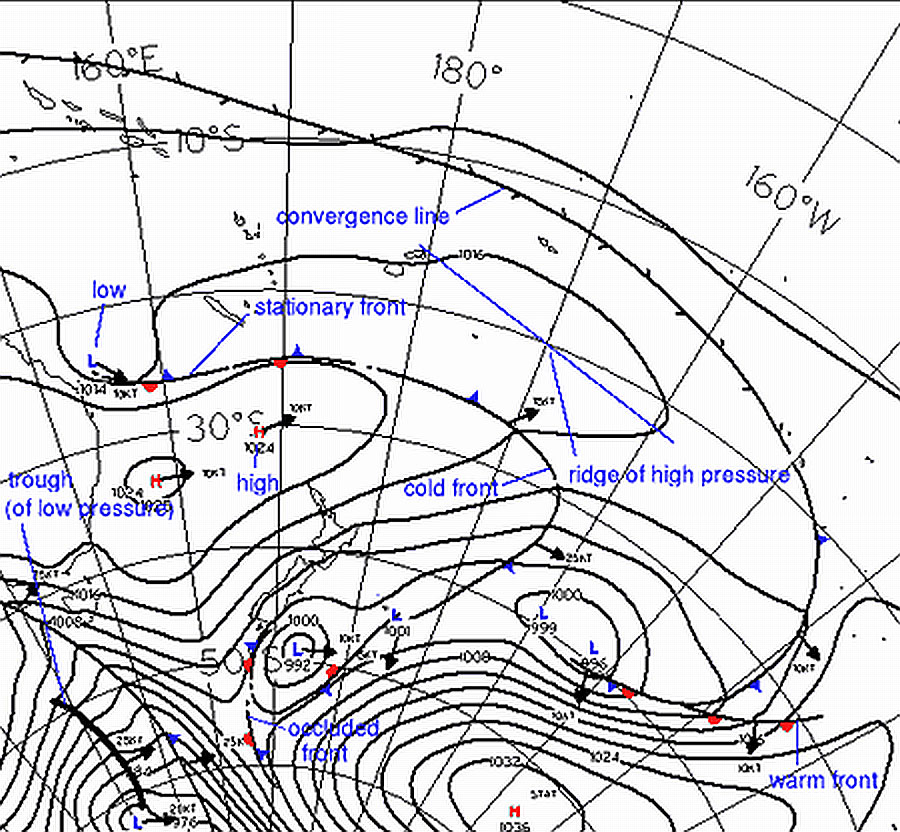
Cold, warm, occluded and stationary fronts. A weather map showing:
- Highs and Lows
- Troughs of low pressure and ridges of high pressure
- Convergence lines