
3-Day Rainfall Map Updates
We’ve made changes to the 3-Day Rainfall Maps on www.metservice.com. Changes are based on feedback from our users, we hope you enjoy the updates.
What's changed?
Improved image quality (higher resolution).
Adjusted and expanded colour scale.
Removed bright blue boundary lines, local maxima, and latitude/longitude guides.
Replaced the wind barbs with arrows.
Added State Highways to the base map.
Replaced purple ‘snow line’ with forecast snowfall accumulation.
Made it easier to jump to zoomed in views of northern, central and southern New Zealand.
Included the model source and run.
What does the change look like?
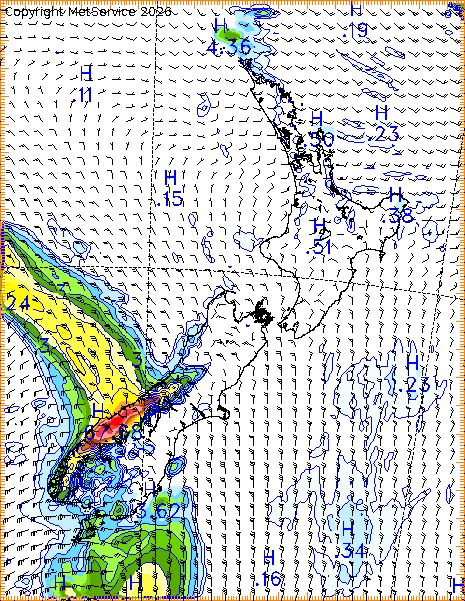
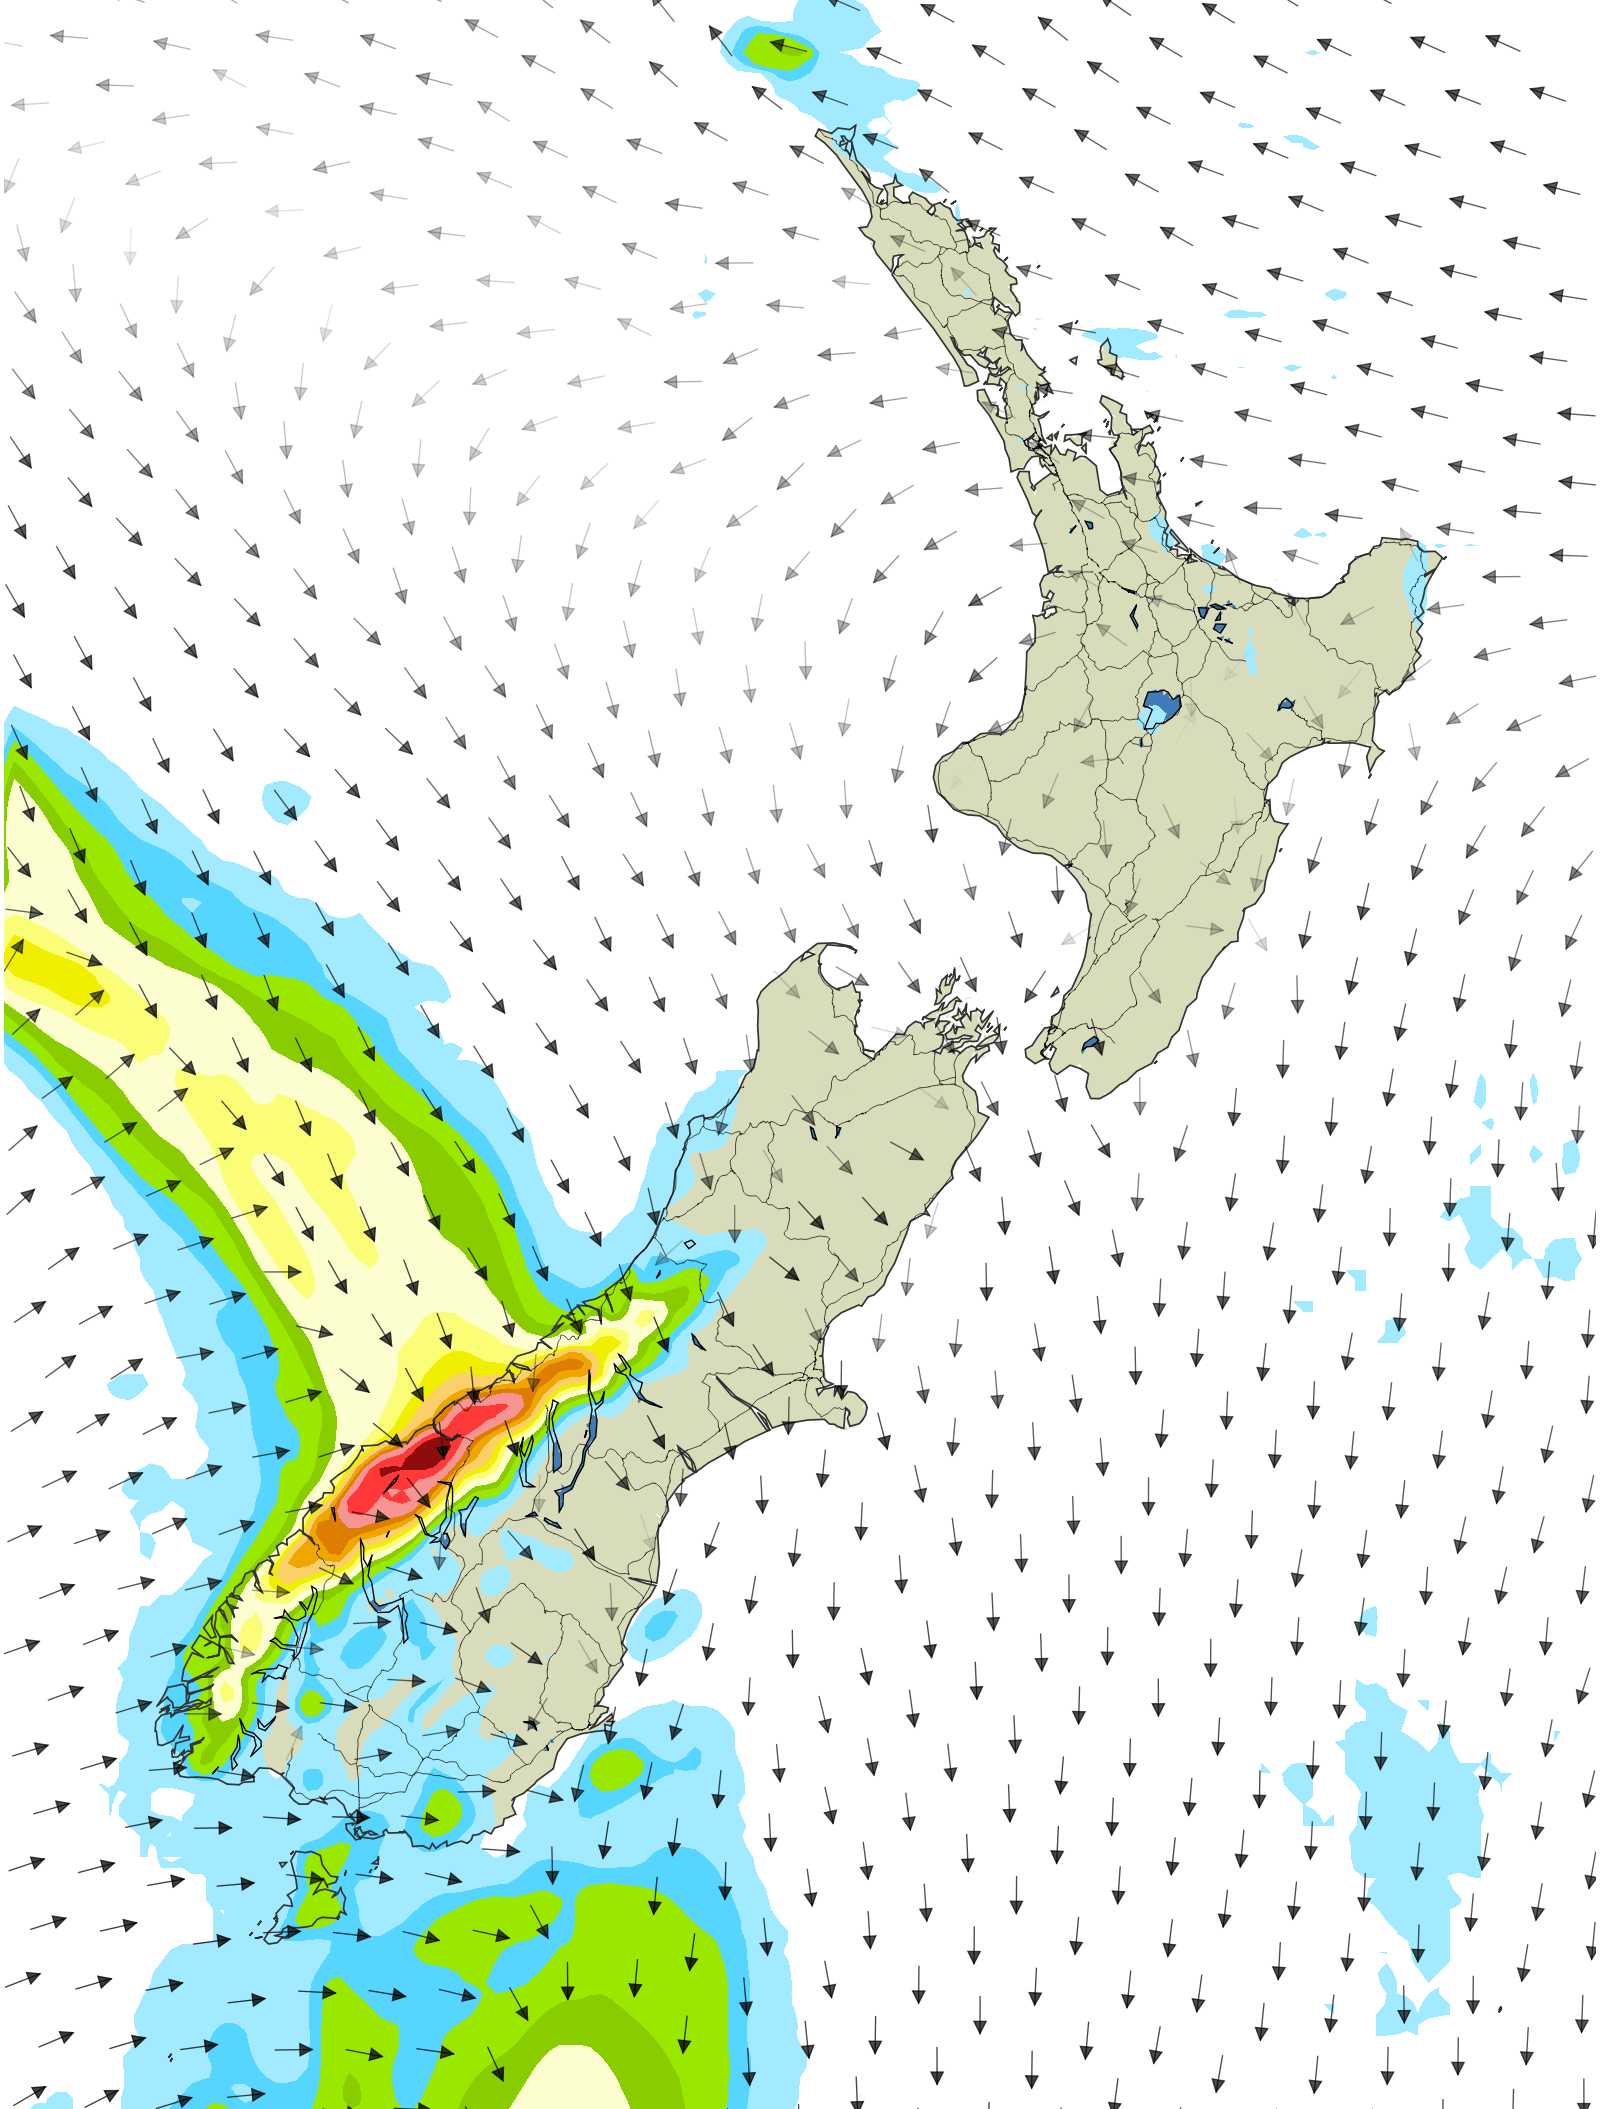
The example below shows the same time period before and after the change.
Before:
Now:
Changes to the key and colour scale
Colour scale
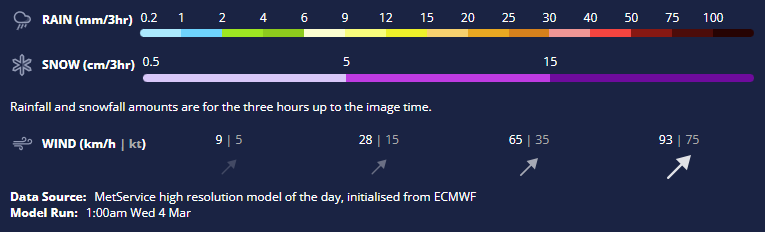
The low end of our colour scale has been adjusted to better reflect definitions of ‘light’ and ‘moderate’ rainfall found elsewhere on our website and app. Now, blue is ‘light’ and green is ‘moderate’.
The scale has been extended to show when areas are expecting more than 50mm of rain in three hours.
Forecasts of less than 0.2mm have been removed. This is such a small amount of rain it is unlikely to be accurate, and if it is, it shouldn’t require you to take any action. It’s less than a standard rain gauge will record!
Snowfall
We removed the purple line which indicated when areas were cold enough for precipitation to fall as snow.
Snowfall accumulation forecasts have been added, letting you know exactly where snow is forecast and how much can be expected.
Wind arrows
Wind barbs have been replaced with wind arrows of varying size and transparency.
Lighter winds are more transparent, stronger winds are darker (more opaque).
Arrows also become bigger when the forecast wind speeds reach gale and severe gale strength.
Data Source
The maps now show which high-resolution MetService model is displayed on the map. Each day our Expert Meteorologists select the model that is most accurately predicting the current weather features. Here you can see which model has been selected and when the model was run.
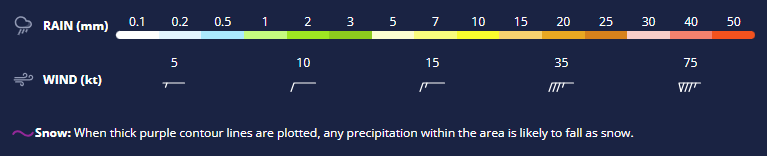
Key and colour scale before:
Key and colour scale now:
Frequently asked questions
-
Our user research showed a strong preference towards arrows. In future, we plan to provide the ability for users to select their preferred option.
-
The previous 3-Day Rainfall Maps did not feature isobars. You can see the side-by-side images above for a comparison. The blue lines on the previous map were isohyets, a line connecting points that receive equal amounts of precipitation during a given period of time.
Isobars are displayed on the 5-Day Rainfall Map
-
This change will only appear on metservice.com to start with then will be added to the NZ Weather App soon. Commercial customers using MetConnect or other MetService products will continue to see the previous 3-Day Rainfall Maps.
-
The maps use the same high-resolution MetService models which are used across our platforms, only the way the maps look has changed.
The models are run just as frequently and are uploaded just as quickly as the previous maps.
-
If you have feedback you would like to share with us you can complete this rainfall map feedback survey